Attract

Overview: This was a 1 year UX Research study in collaboration with Digilab to investigate functional UI animations and measure them with a mixed-methods approach methodology investigating different parameters and their influence on the animations scroll, bounce and fade; as well as their impact on task efficiency and visual attention provided by an eye tracker device in a cultural heritage website.
My Role: UX Design, UX Research, Product development, Project Manager
Tool Kits: Eyetracking software Gazepoint, Figma, Qualitative & Quantitative Research, Front-end Development, R Studio and Excel for data analysis
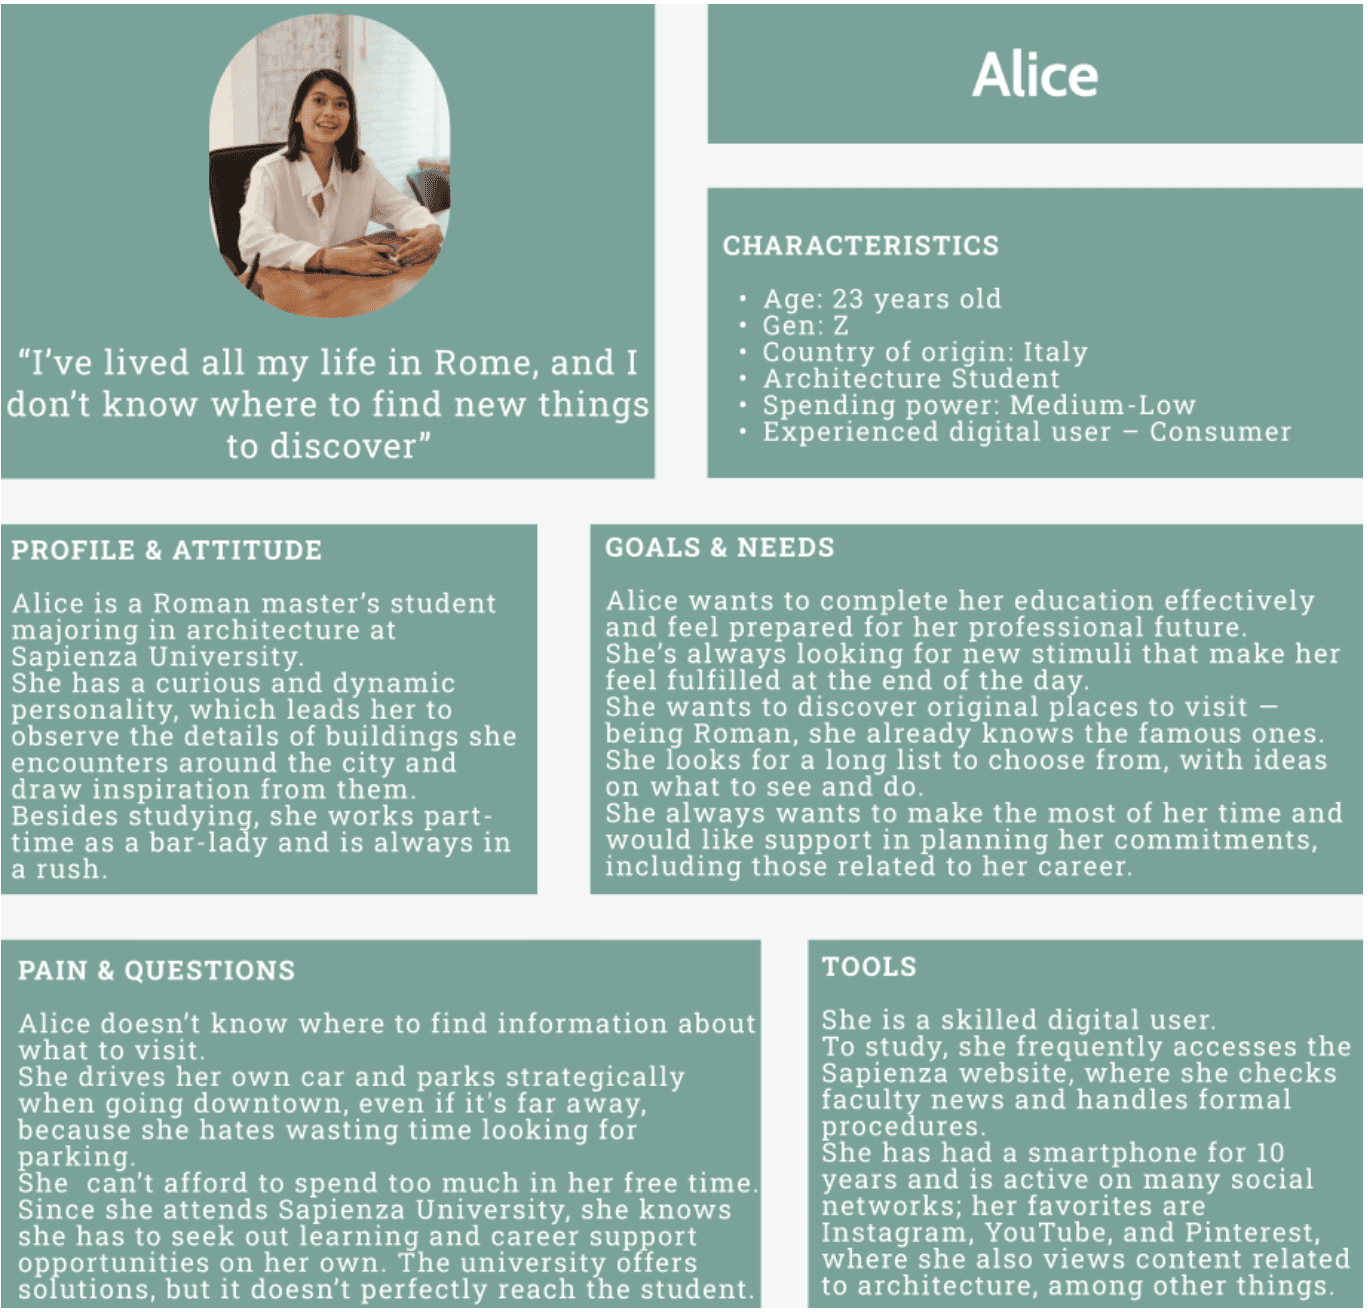
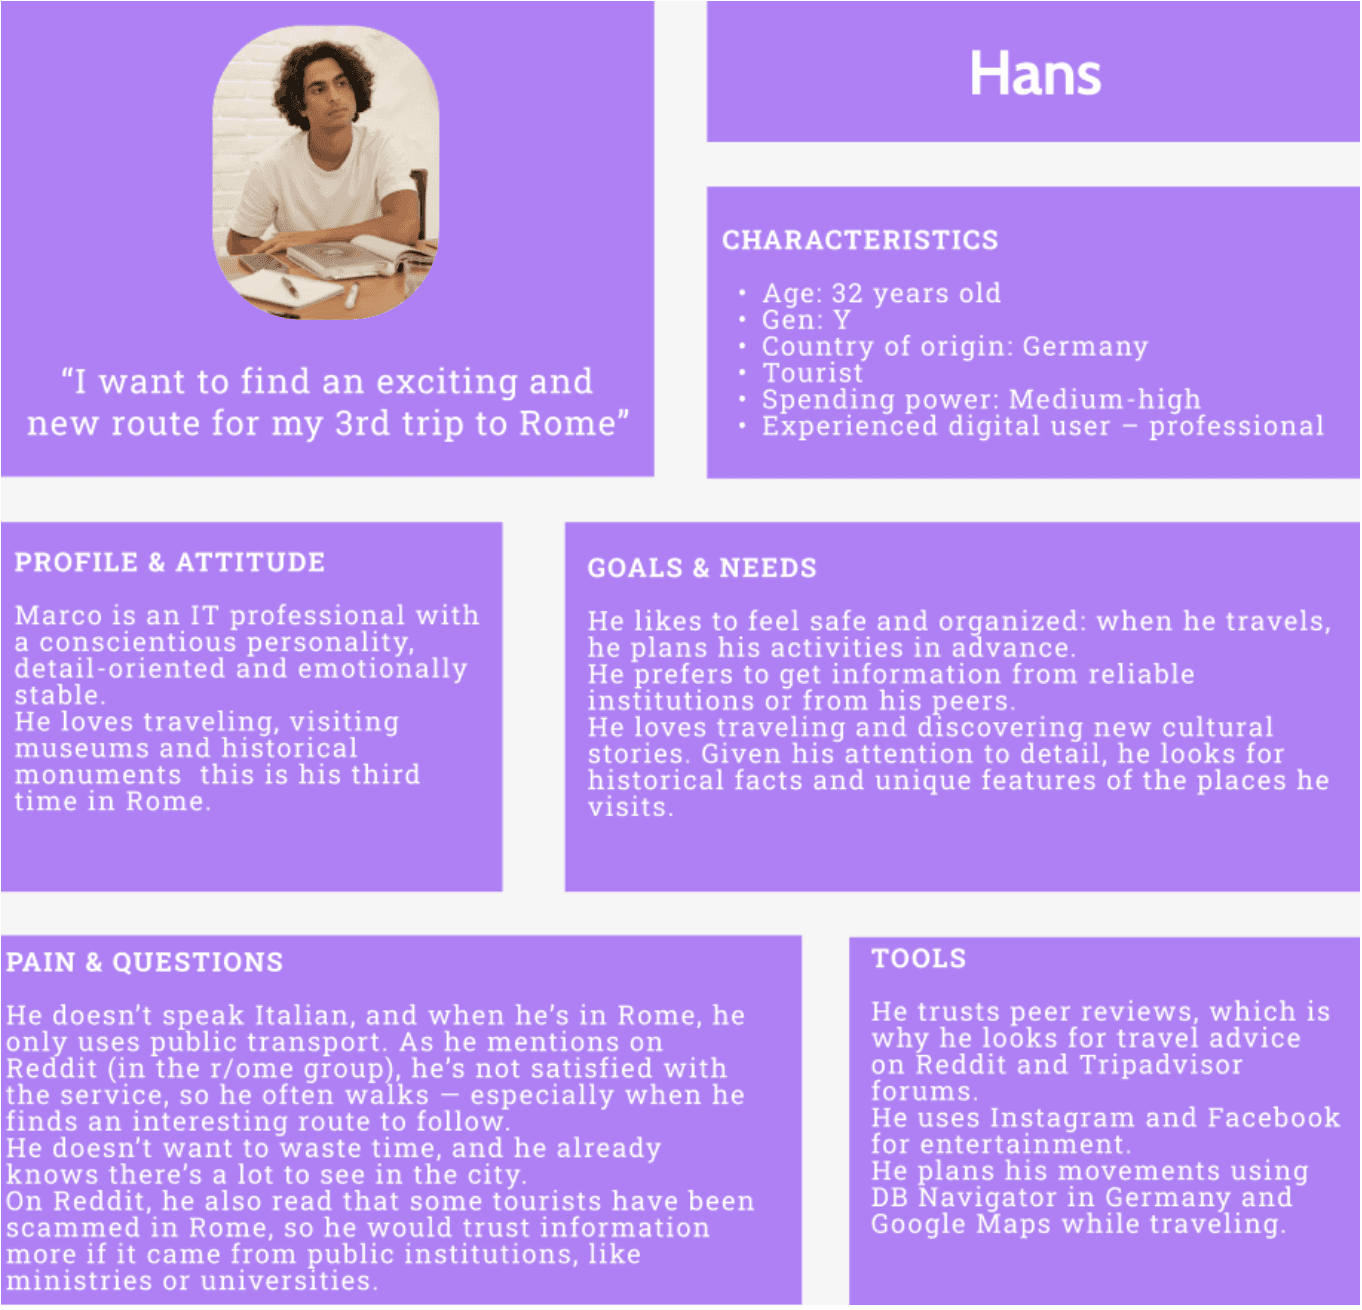
Users: 20-30 year old people visiting or residing in Rome looking for hidden gems. They are interested in various topics such as but not limited to: architecture, archeology, history, and tourism.
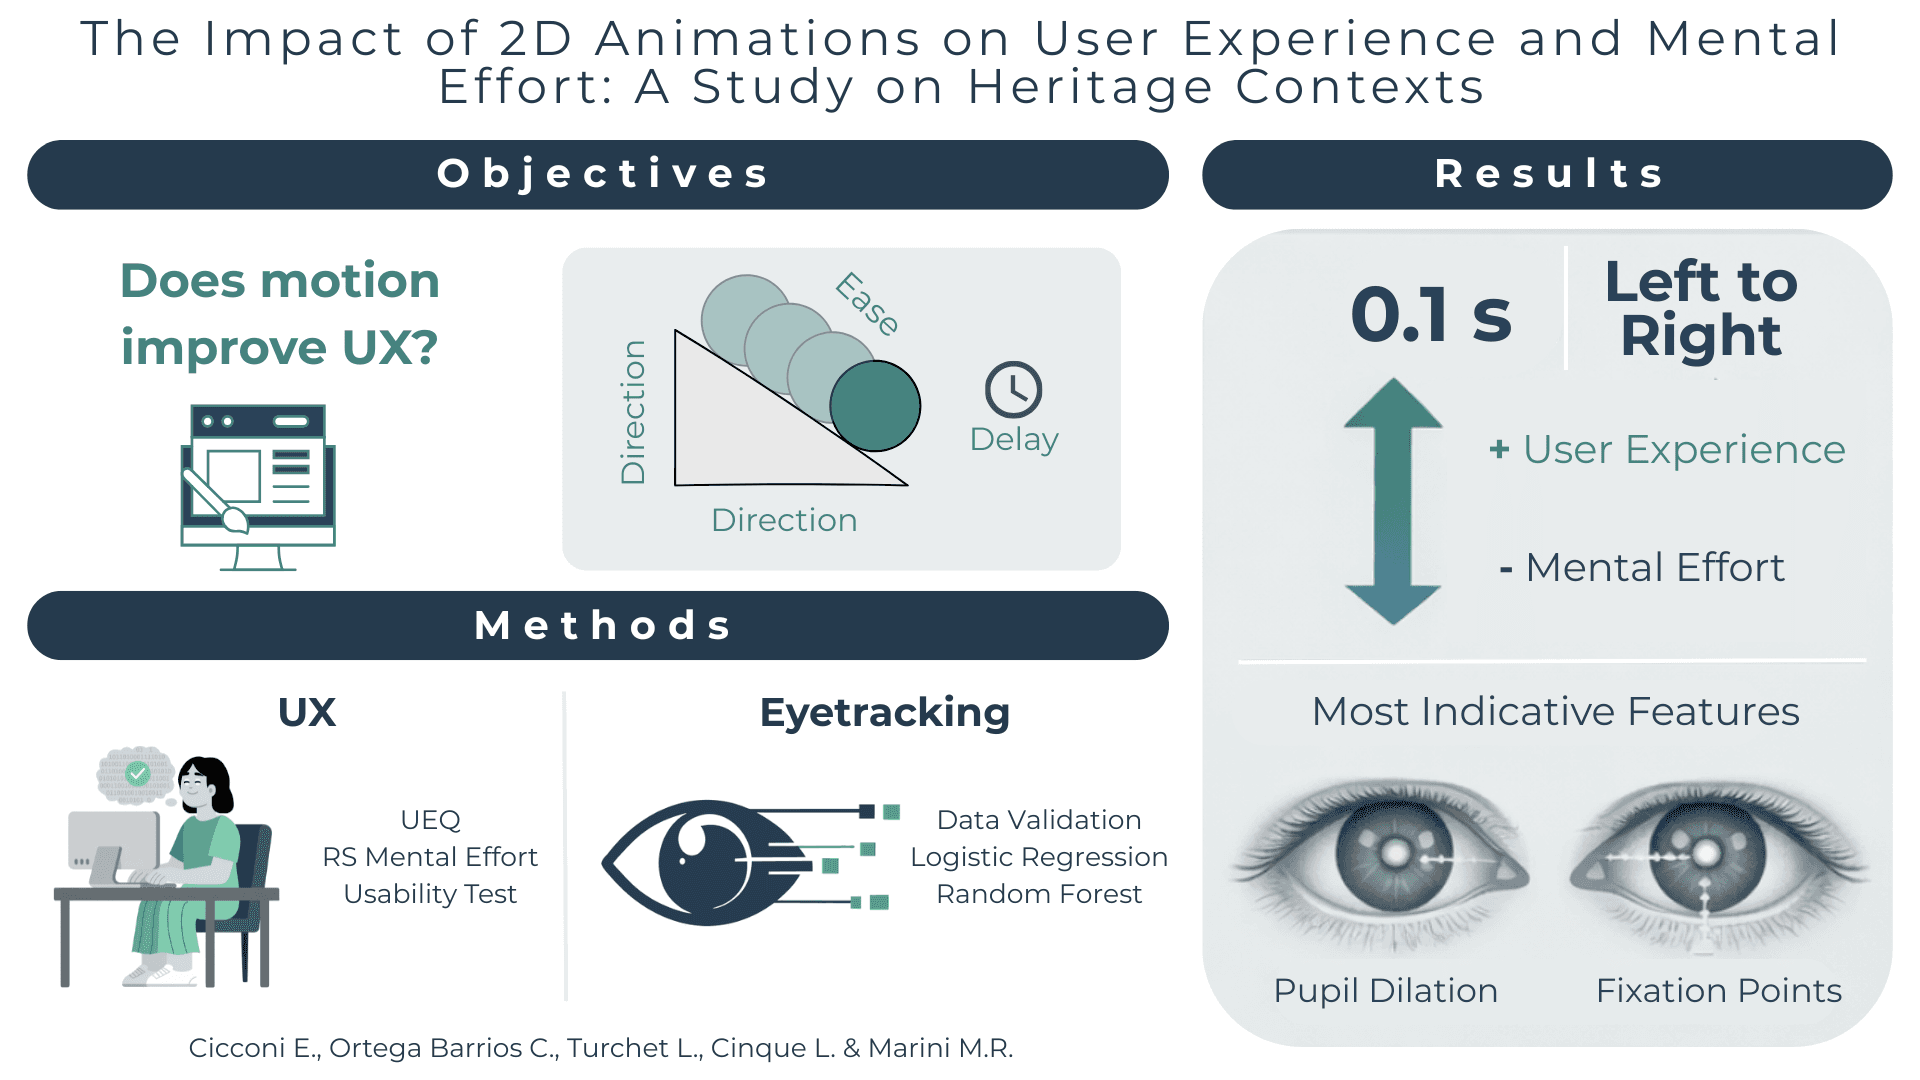
Outcome: The research identifies the high influence of parameters like ease, delay, and direction on perceived task performance and gaze behavior, with gender emerging as a significant demographic factor in user perception.
*This research is currently under review to publish in the International Journal of Human-Computer Interaction.
1. The Background
2.Finding Our Users
3. The involved protocol
3.1. The parameters 3.2. The tasks
4. So what is the best type of animation?
5. My Biggest Learnings
The background
Functional animations play an important role in modern user interfaces, they are present in every website and app. Specially, its use in social media is seeing a boom, since they help the users understand where their attention needs to go and they help them focus on what is important.
However, a misuse of these can contribute to a bad user experience and can compromise their efficiency.
RQ1. How can functional animation interactions be systematically measured to assess their impact on usability and user experience?
RQ2. How do different 2D animation interactions influence users’ visual attention and task efficiency during repeated interactions?
The Digital Travel Market is estimated to be valued at 608.4 billion USD in 2025. Consumers in this market, have made possible an annual growth rate of 15% with the leading segment being international travels.
According to the Future Market Insights, special attention should be placed in the investment of digital platforms, combined with cybersecurity and localized travel platforms to support the sustained growth across global digital travel.
Platforms like Attract from Archeolab, want to tackle the need of the cultural heritage preservation through a digital canal. Attract is a platform where not so visited sites in the Lazio region are shown, which could also help tourists to discover historical sites outside of the city center of Rome.
Finding our Users
To imagine the type of people that would use the platform Attract, we had to dive deep with the Digilab team and gather the data of different profiles from the current users that set the base to craft the following user personas:
The involved protocol
Before each session, every participant was provided with the privacy information details, and all subjects gave verbal informed consent. The study consisted of a single session lasting about thirty minutes. Each participant completed a pre-experiment attitudinal questionnaire, performed short computer-based tasks, evaluated the systems they interacted with, and finally took part in a brief, struc- tured interview. Since this was a within-subjects experimental design, each participant evaluated all versions of the developed website.
For each task, the participant clicked the link in the form, which opened a new browser tab. In that tab, a version of the website was displayed with the manipulated animations. Upon completing each task, the participant closed the opened tab and returned to the form page to complete the evaluation.
The experiment was conducted in a controlled laboratory setting using a 32” monitor with participants seated approximately 60 centimeters from the screen. During task execution, eye movements and screen activity were recorded in order to collect objective behavioral data. The Gazepoint GP3 Eye Tracker device was used, a system operating at a 60 Hz sampling frequency and featuring 9-point calibration. Data acquisition and analysis were performed using the software Gazepoint Analysis Professional Edition (version 6.11.0, x64).
A total of 32 participants were gathered and interviewed for this thesis research, considering that the participants needed to have normal vision or corrected vision (with glasses) that the eye tracker software could recognize. These people contained varied specializations and interests. There were different levels of educational backgrounds, and their interests include: psychology, architecture, computer science, 3D modelling, archeology and others, which was a great advantage to prevent biases with a specific group.
3.1 The parameters
Scrolling: In a cluttered text-based content
A) Direction: Left to Right / Top to Bottom
B) Delay: In
C) Ease: In / Out
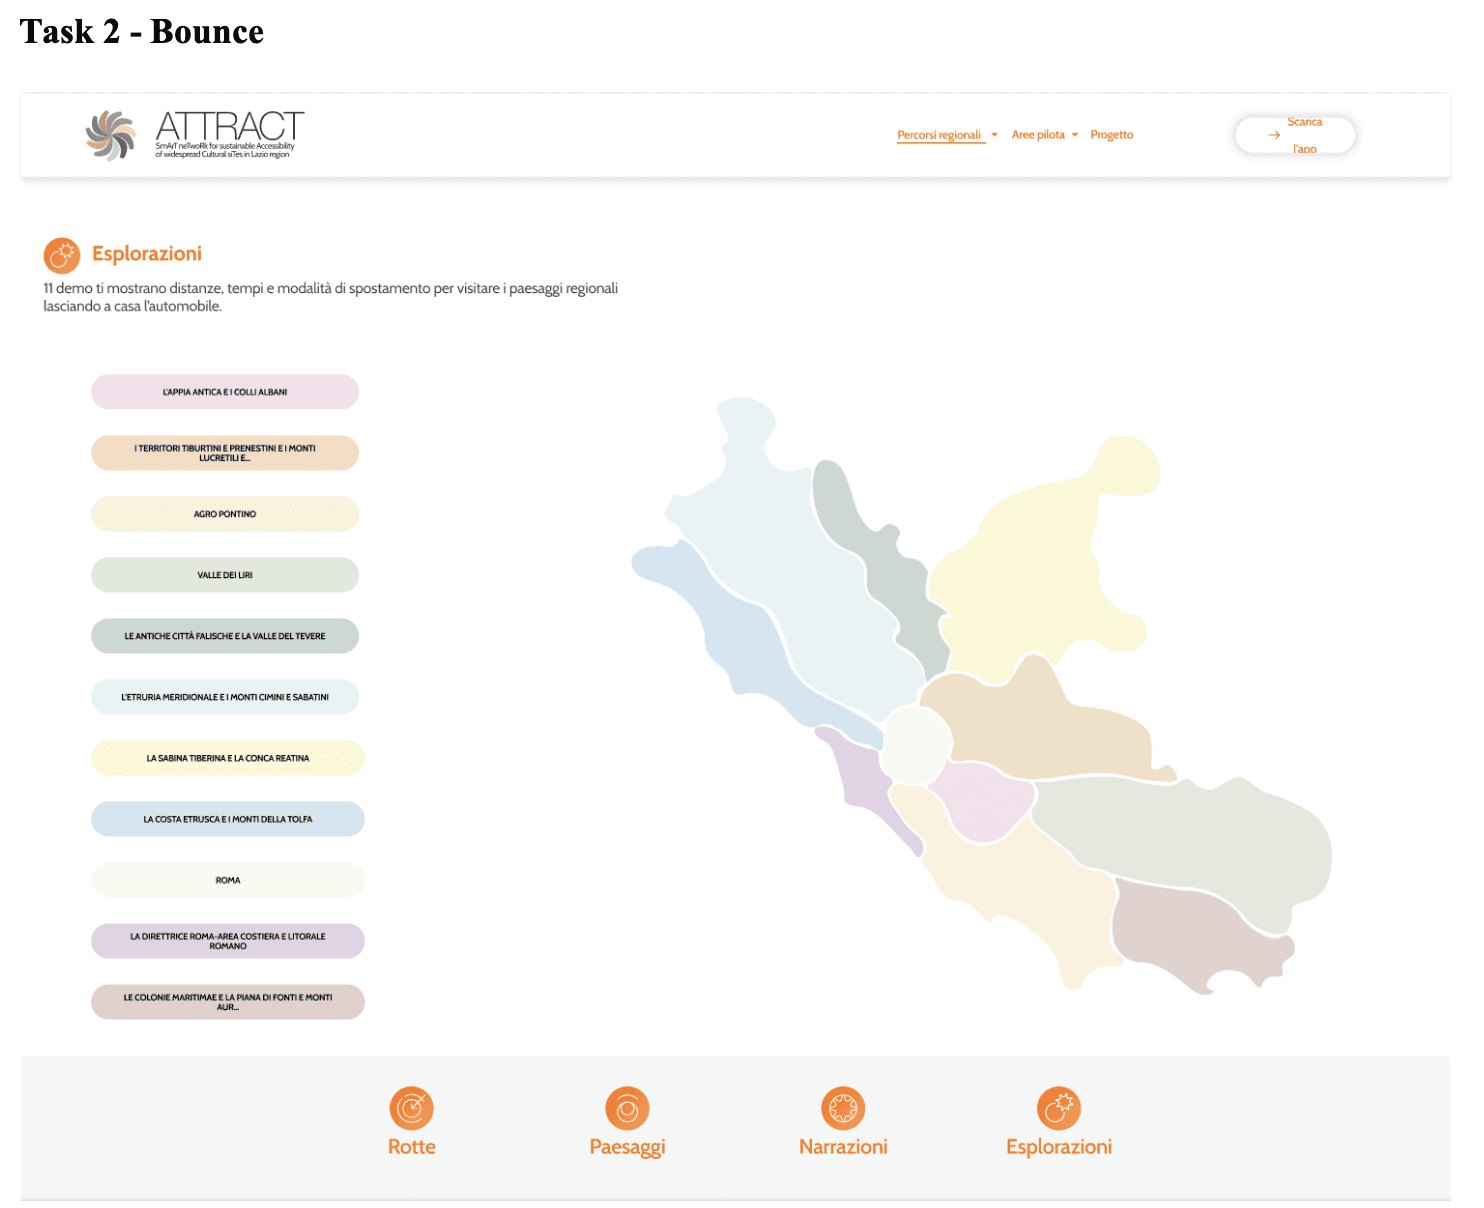
Bounce: Interaction with the elements of a map of regions and its list of regions
An important finding that must be mentioned is that for the bounce animation, the direction Left to Right is not mentioned in any study. In professional libraries like Tailwind CSS, Animate.css and Bootstrap there are options to use the “bounceInLeft” type of animation, however when looking at empirical research [46] and usability guidelines, this type of entrance is normally distracting for users. Users are not used to this extremely noticeable animation unless it is found after the loading of a homepage. However, the wide popularity of the “like” animation has made pulsing (a type of bounce animation) widely recognized and is proved to have good feedback from users. This is the underlying factor as to why in this study, instead of the direction Left to Right, Pulsing is considered as the replacement of this specific direction.
A) Direction: Top to Bottom / Pulsing
B) Delay: In
C) Ease: In / Out
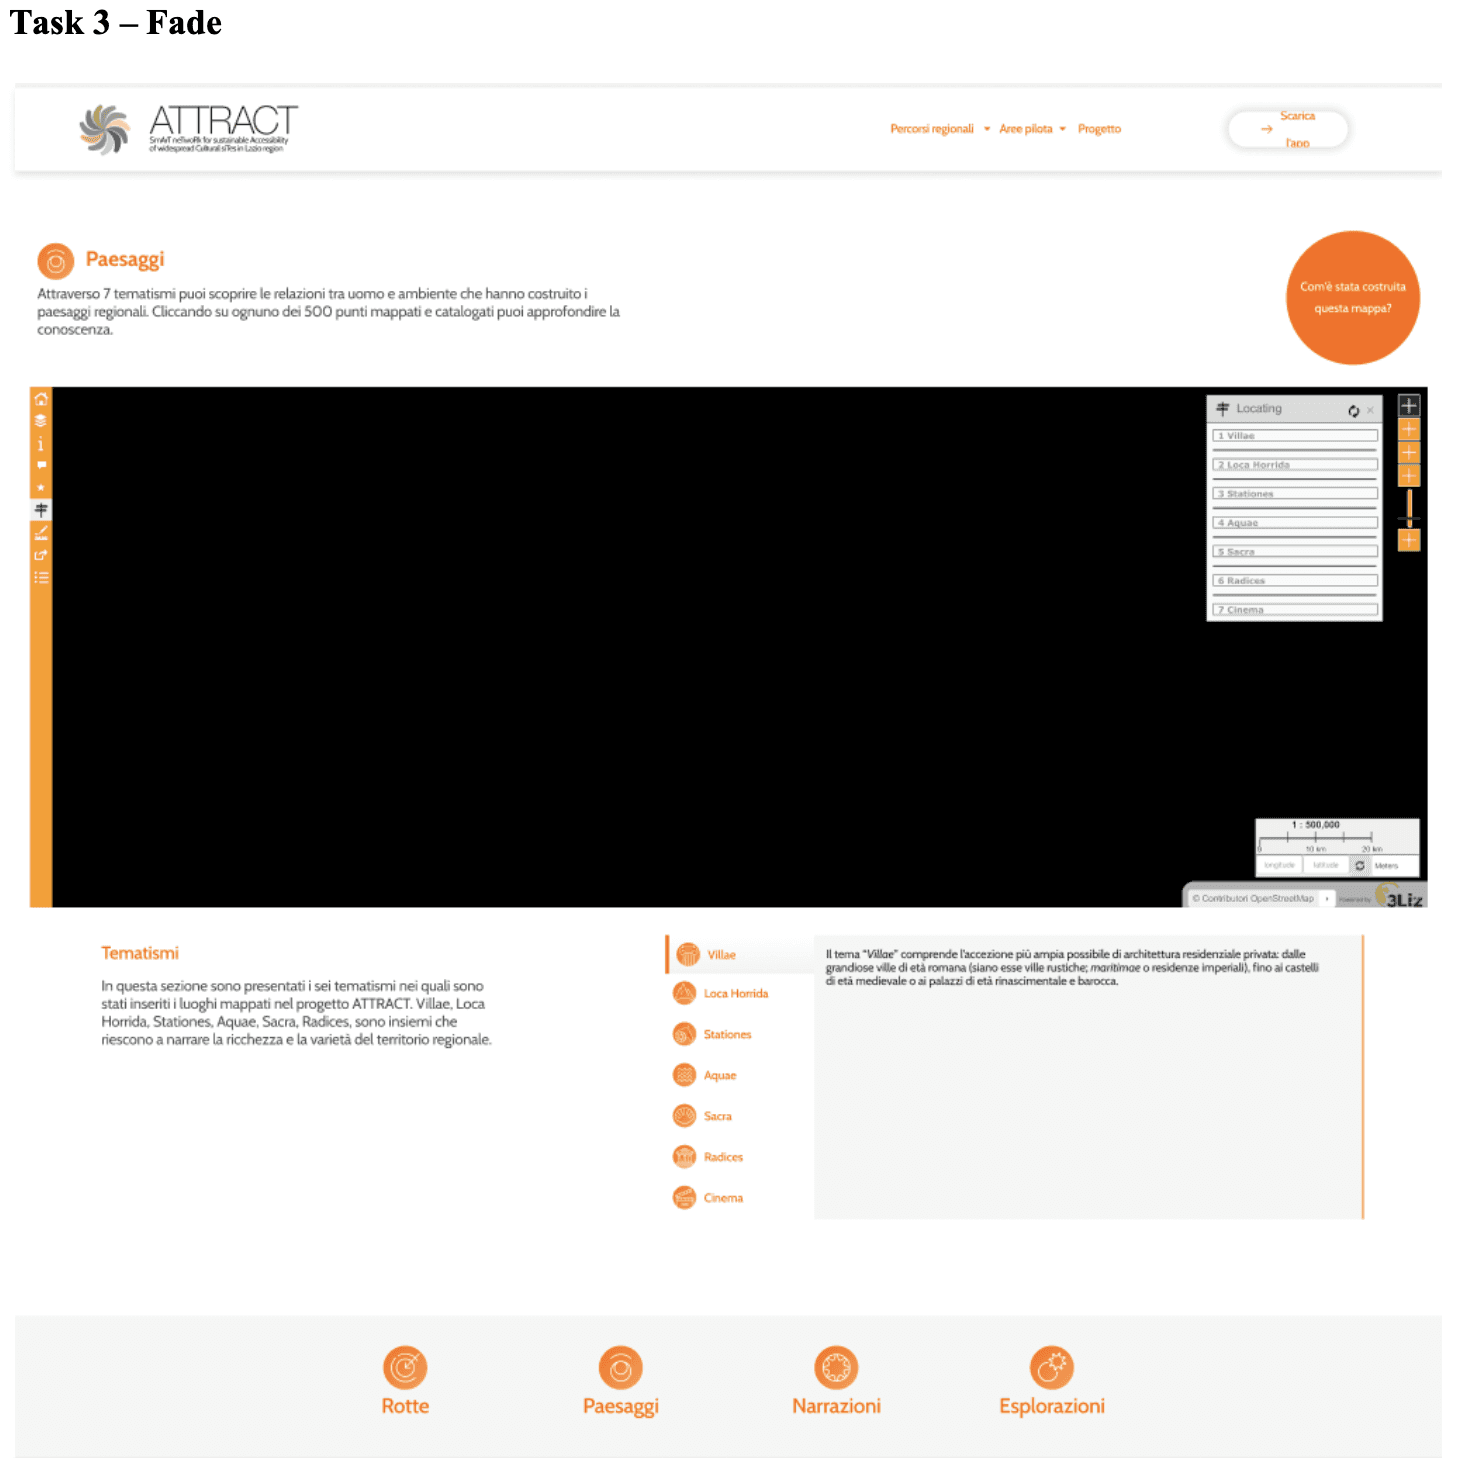
Fade: List of categories appearing element by element
A) Direction: Left to Right / Top to Bottom
B) Delay: In
C) Ease: In / Out
3.2 The tasks
The tasks were crafted so that any user could complete them. Regardless of the fact that most of the participants had never interacted with the platform before. Some browsing was required, but excessively detailed tasks were avoided to keep a low cognitive load and prevent involving memory effects for participants throughout the 27 tasks.
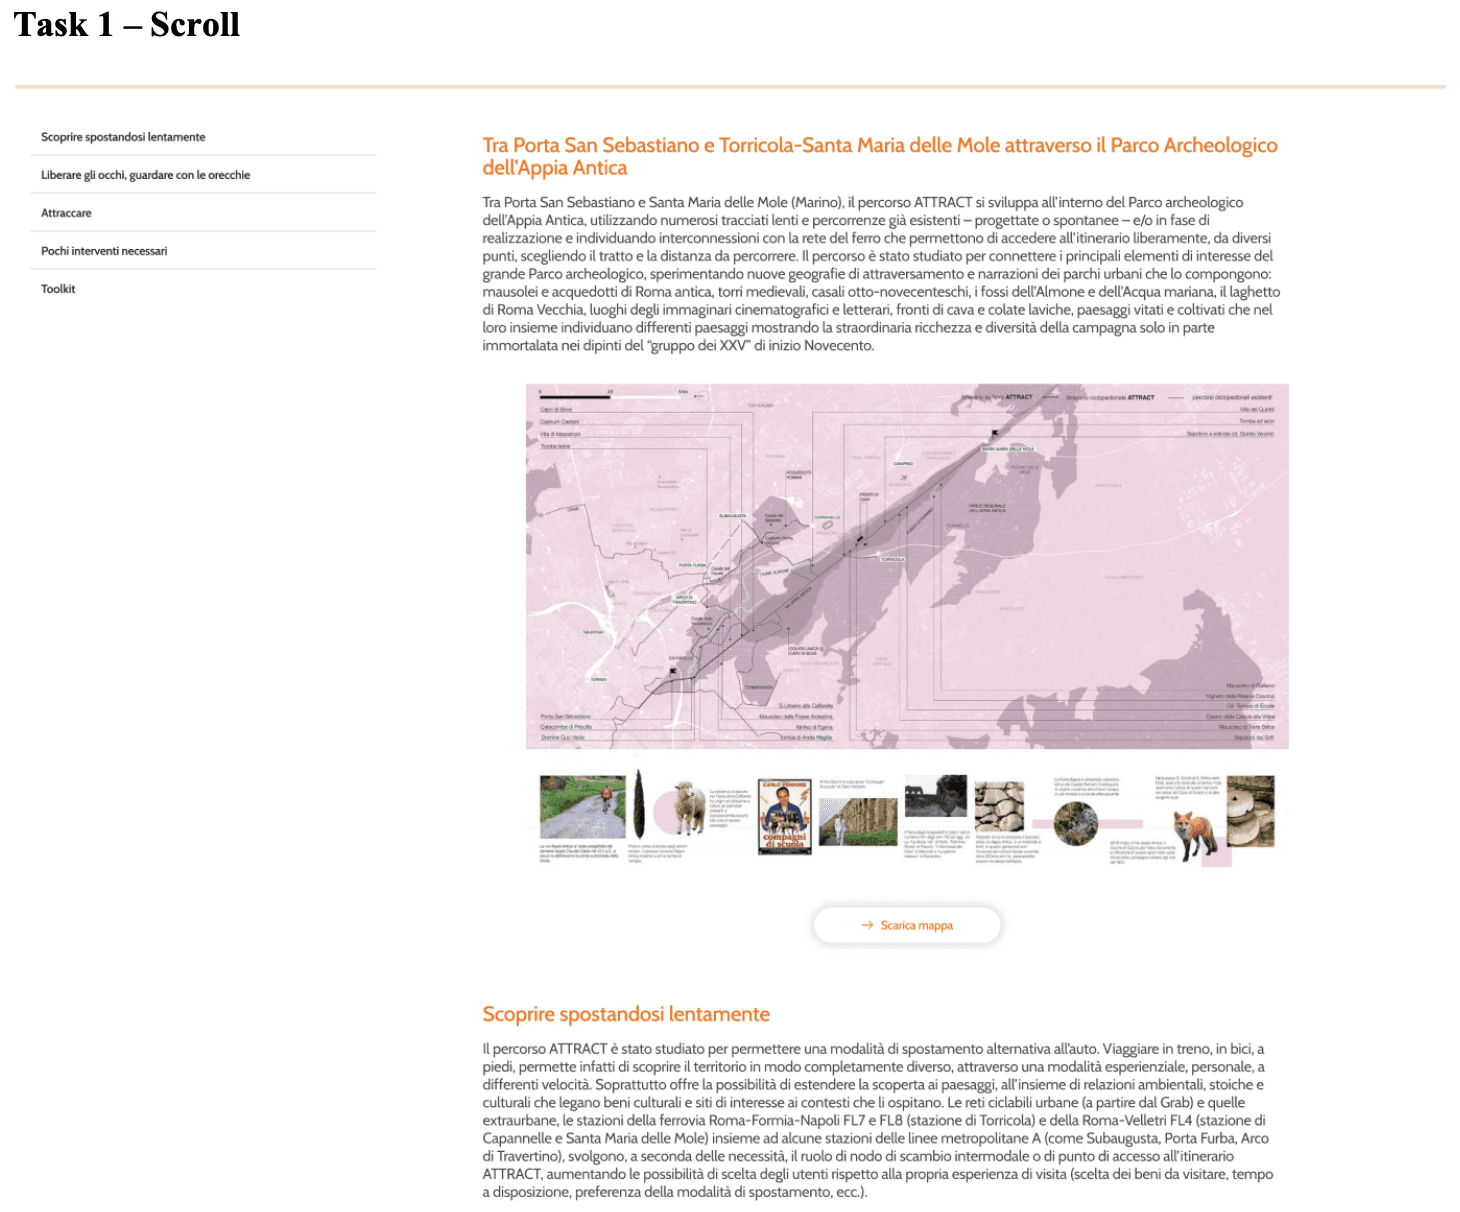
Task 1 – Scroll: Find the toolkit section of the Appian Road and the Albian Hills.
Task 2 - Bounce: Identify on the map of 'Explorations' the region of ‘The Tiberina Sabina and The Reatina Basin’.
Task 3 – Fade: Find out in which position in the list ‘Stations’ is located.
The interface for each task:
So what is the best type of animation?
The best performing animation parameters evaluated for the Scroll Task were: 0.1s, Ease In, From Left to Right.
Consistent with W3C and Klein & Bederson, the immediacy (0.1s) of the animation positively influenced perceived hedonic quality and overall evaluation. The direction aligns with the natural reading direction in countries using a Latin writing system. Moreover, the left side of the text is the only one scanned by the gaze during webpage scrolling, following an “F-shaped” pattern (Nielsen, 2006). Users likely found the delay of the scroll-driven animation annoying.
During search tasks, the gaze naturally follows the F-pattern, which may have been disrupted during the top to Bottom animations. In the instantaneous-delay condition, participants likely had trouble maintaining spatial reference points during reading, while in the 1s-delay condition they had enough time to establish these reference points.
A further possible explanation for why the Top to Bottom 1s condition was highly appreciated may lie in its similarity to the typical lazy loading content animation, commonly encountered during social media interactions. Indeed, the perceived familiarity of a webpage positively affects UEQ scores.
A significant finding that women rated tasks more positively than men indicates that one animation does not suit all types of users. The results show markedly more positive evaluations from female participants compared to males, regardless of the combination of animation motion features observed.
Feel free to check out the figma here to dive deep in the tasks!